NEOTRADER CHART OF INTEREST – AUROPHARMA
This is our new series called Neotrader Chart Of Interest. NeoTrader has incorporated every type of pivot, in every pivot page we has 3 circles below every stock to depict the status of different timeframes(first circle for daily, second for weekly and third for monthly) without going to chart and jumping over different timeframes.
In the CPR page we have made a whole different section for those stocks which are outperforming and have a strong price trend reflected by either all 3 circles as green ( for bullish) and all 3 circles as red (for bearish) across different stock universe (NIFTY 50, NIFTY BANK.NSE 500,etc)
These type of stocks are available on just one click of the Curated button.
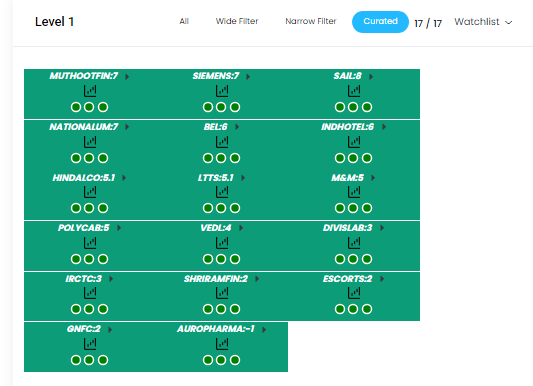
Traders can make a watchlist of these CPR curated stocks and use other technical tools/indicator to further narrow it down.
We have used RSI Dashboard page>>>>>>>Breakout section to see if any kind of recent breakout have occurred as per RSI.
One such stock which we find interesting is AUROPHARMA due to it’s bullishness and all timeframes and a recent RSI 60 cross.
In our Chart of Interest today, we find that AUROPHARMA has number 3 mentioned in daily timeframe, this number tells us since how many bars ago the RSI breakout came. The idea behind introducing this was to help traders make decision in those stocks which had a signal and have started their move.
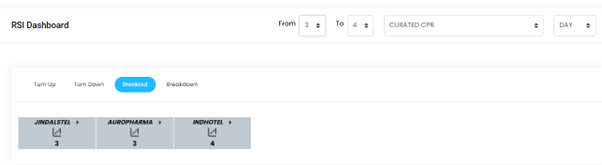
Keeping the filter at Number 3-4 will help find those stocks which had given signal and price has successfully started to move in favour of the signal.
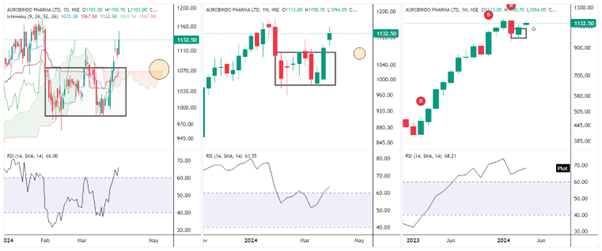
Now coming on the chart.
On daily weekly and monthly we have RSI levels above 60 and a range can be seen on daily and weekly chart, earlier on 04-03-2024 we had a failed recovery and RSI just touched 60 and reversed.
With the swing recent breakout we can see RSI is well above 60 and moving up since last 3 trading session(same which we discussed using RSI Dashboard>>>>Breakout).
A bullish ICHIMOKU TWIST is also forming indicating us of an end of corrective move and resumption of the primary bullish trend.
Traders can buy at current levels around 1130-1135 with the SPAN B as stop loss which is at 1067 and a target towards 1200 and 1240
Additional Links
RSI PAGE – https://neotrader.in/index/rsi_trends/
Power Trading with RSI – https://training.neotrader.in/courses/Power-Trading-With-RSI-624c34f70cf2ce7ce631773e
How to use RSI like a pro https://www.youtube.com/watch?v=1K3Bd52KFAs&t=1363s&pp=ygUNcnNpIG5lb3RyYWRlcg%3D%3D
Simple ways to trade with RSI- https://www.youtube.com/watch?v=f_vzmE-S93Q
Help documents and videos for RSI and ICHIMOKU are available on the specific pages within NEOTRADER.
Leave a Reply
You must be logged in to post a comment.